BENEFITS, BUILT AROUND YOU

Better benefits. Smarter spending.

Spend smarter. Give your people better choices.

Illustrative portrait of one professional sitting at a sunlit workplace desk.
Illustrative AI-generated photography.
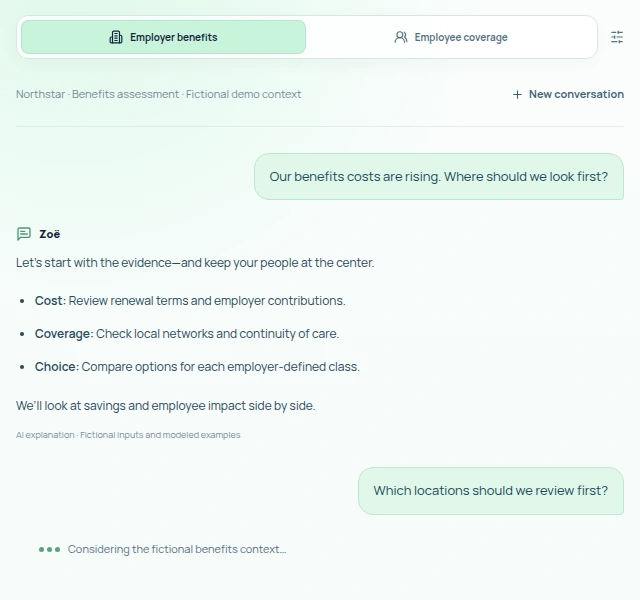
Screenshot of Zoë reviewing benefits costs, coverage and employee choice in an illustrative employer conversation, with a follow-up question in progress.
Zoë, in conversation. Illustrative conversation
THE COST OF EMPLOYEE BENEFITS

Benefits cost context starts with documented sources.

Review source scope before comparing a self-reported employer baseline.

ReportedBLS
30%

Of compensation goes to benefits

U.S. private-industry employer compensation.

June 2026All benefits, including paid leave and retirement—not healthcare alone.
ReportedAHRQ MEPS-IC
$26,281

Average annual family health premium

National private-sector establishments that offer health insurance.

2025 reference year · Table II, II.D.1Combined employer + employee premium per enrolled employee; not employer-only or per eligible employee.
8.2%

Projected health-cost growth in 2027

Expected per-employee increase after planned cost reductions.

2027 projection · Aug. 2026 survey updatePreliminary employer expectations—not observed results or guaranteed savings.

2025 annual health premium by coverage tier

Actual 2025 national mean total premiums by coverage tier · Employer + employee · Per enrolled employee · USD · Not a historical trend

AHRQ MEPS-IC · 2025 United States workbook · 2025 reference year · Table II
View source data
2025 annual total premium by coverage tier · employer + employee · per enrolled employee · USD
Coverage tier2025 annual total premiumTable / cellsOriginal source
Single$9,025II.C.1 · C50 / SE K50 · SE $55Original AHRQ workbook
Employee + one$17,901II.E.1 · C96 / SE K96 · SE $126Original AHRQ workbook
Family$26,281II.D.1 · C73 / SE K73 · SE $176Original AHRQ workbook

Better value for your business. Better choices for your people.

How Benefy works for you.

See benefits spend clearly.

Understand spending, renewals and employee impact.

  • Trace spending.

    See sample costs, vendors and fees together.

  • Compare trade-offs.

    Review modeled scenarios, assumptions and gaps—not achieved savings.

  • Protect coverage.

    Keep premiums, deductibles, access and continuity in view.

One connected journey.

From costs to choices.

Better value. Not less coverage.

Compare cost, coverage and choice—together.

See how
Illustrative portrait of one adult enjoying a quiet moment at home.
Illustrative AI-generated photography.

Make benefits work better.

Talk to us